What's an inverted yield curve? What does it mean for you?
What's an inverted yield curve? What does it mean for you?
S.F. Ehrlich Associates |
June 30, 2019
It’s possible you may have heard the term inverted yield curve by reading about it in a financial publication1 or while aimlessly surfing through the 500 channels offered by your cable provider.
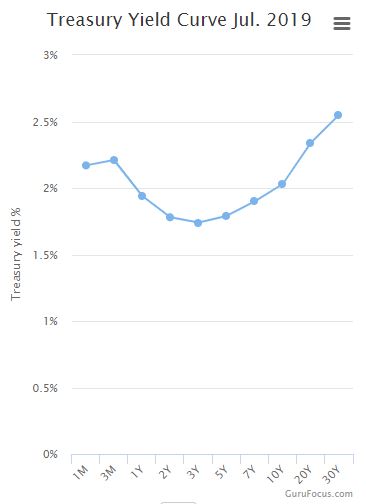
Simply put, an inverted yield curve means the yield on a Treasury bond that matures in 10-years is lower than the yield provided by a Treasury certificate that matures in 3-months. This relationship shows the lack of confidence investors have in longer-term bonds and is considered an indicator that a recession is coming. When that ‘curve’ slopes down, it represents an inversion.
As noted by Vanguard2, “Historically, an inverted yield curve typically lasting more than a month has reliably predicted recessions. In fact, since 1970, an inverted yield curve has preceded all seven U.S. recessions. The time between an inverted curve and the subsequent recession has ranged from 5 to 17 months.”
Is this time different? While there’s no doubt a recession is in our future (recessions are an inevitable component of all business cycles), a recession may not necessarily be in our immediate future. The argument for a delay in the onset of a recession is that the economy is in generally good condition. Households, for example, don’t hold the debt they held during the Great Recession. Similarly, we don’t have the housing bubble that we had 12 years ago that negatively impacted the economy in 2008-2009. Also, the debt held by corporations has a much lower interest rate than it did in 2008, which means companies are better able to service that debt.
There are other events that can potentially impact the severity and even the timing of the next recession. The best action to take in the interim? Rebalancing portfolios. Trying to time the market – like predicting when a recession will occur and how much the stock market may fall – is still a bad option
1 Nathanson, Michael J., et al. “Gauging the next Recession's Severity.” Financial Advisor Magazine, June 2019, pp. 35–38.
2 Staff, Vanguard. “What the inverted yield curve might mean.” Market Perspectives. 20 May 2019.
Please remember that past performance may not be indicative of future results. Different types of investments involve varying degrees of risk, and there can be no assurance that the future performance of any specific investment, investment strategy, or product (including the investments and/or investment strategies recommended or undertaken by S.F. Ehrlich Associates, Inc. (“SFEA”), or any non-investment related content, made reference to directly or indirectly in this newsletter will be profitable, equal any corresponding indicated historical performance level(s), be suitable for your portfolio or individual situation, or prove successful. Due to various factors, including changing market conditions and/or applicable laws, the content may no longer be reflective of current opinions or positions. Moreover, you should not assume that any discussion or information contained in this newsletter serves as the receipt of, or as a substitute for, personalized investment advice from SFEA. To the extent that a reader has any questions regarding the applicability of any specific issue discussed above to his/her individual situation, he/she is encouraged to consult with the professional advisor of his/her choosing. SFEA is neither a law firm nor a certified public accounting firm and no portion of the newsletter content should be construed as legal or accounting advice. A copy of SFEA’s current written disclosure Brochure discussing our advisory services and fees is available upon request. If you are a SFEA client, please remember to contact SFEA, in writing, if there are any changes in your personal/financial situation or investment objectives for the purpose of reviewing, evaluating, or revising our previous recommendations and/or services.