


Fun With Charts!
Consumer confidence and finances are two critical components of the economy.
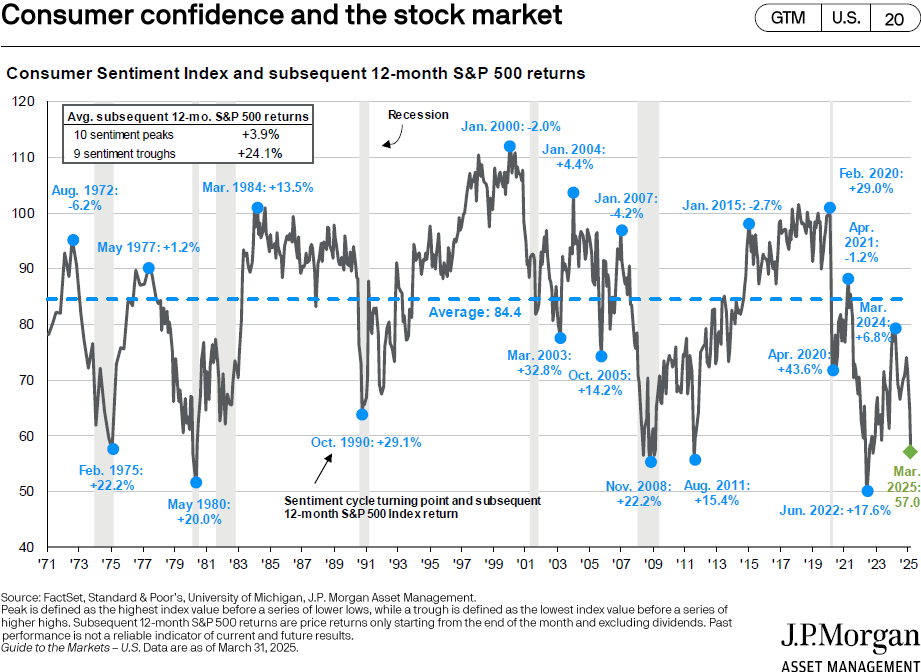
Notice how consumer sentiment and the stock market are linked on the chart below1. When consumer confidence peaks, the subsequent 12-month return for the stock market tends to be lower. Conversely, when consumer sentiment bottoms, notice the returns for the S&P 500 are higher. (Unfortunately, peaks and troughs are only known after the fact. We don’t know if consumer sentiment is currently low and heading lower, or if this represents a trough, indicating that sentiment and markets are about to move higher.
If consumers are doing well financially, they pay their bills on time. When our financial situation gets more precarious, things can change.
The chart below2 shows what comprises the “consumer balance sheet,” which is effectively a compilation of all our individual balance sheets. As can be seen by the graphs on the left side, consumers have far more assets than liabilities. Cash flow, however, is a different issue.
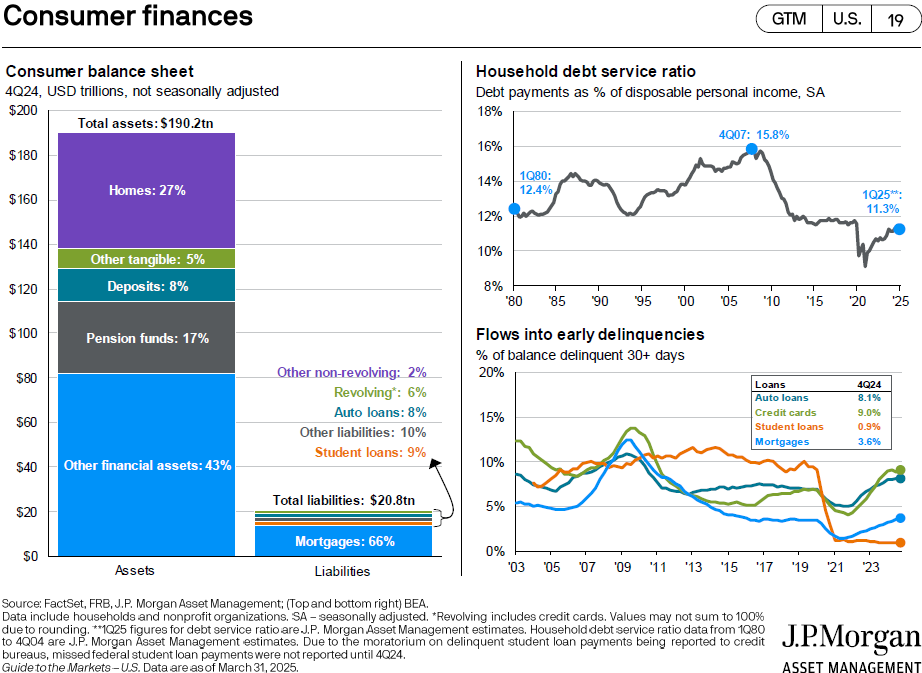
Household debt service ratio (chart): shows debt payments as a percentage of disposable income. The graph illustrates the percentage of our income allocated to paying ongoing debts. Suffice it to say that as we spend more of our income on debt, we have less money to spend on buying goods and services.
Flows into early delinquencies (chart): an indicator of how much consumers are likely to spend in the coming months. (If consumers can’t pay their debts, they’re unlikely to increase spending on goods and services.) Note how the graphs are rising, which depicts higher delinquency rates. Look at the numbers in the small box: delinquency rates for auto loans (8.1%), credit cards (8.0%), student loans (0.9% as of 3/31/25 due to loan deferment programs, but now being reported as close to 25%), and mortgages (3.6%).
! “Consumer confidence and the stock market,” Slide 20, Guide to Retirement, J.P. Morgan. March 31, 2025.
2 “Consumer finances,” Slide 19, Guide to Retirement, J.P. Morgan. March 31, 2025.
Please remember that past performance may not be indicative of future results. Different types of investments involve varying degrees of risk, and there can be no assurance that the future performance of any specific investment, investment strategy, or product (including the investments and/or investment strategies recommended or undertaken by S.F. Ehrlich Associates, Inc. (“SFEA”), or any non-investment related content, made reference to directly or indirectly in this newsletter will be profitable, equal any corresponding indicated historical performance level(s), be suitable for your portfolio or individual situation, or prove successful. Due to various factors, including changing market conditions and/or applicable laws, the content may no longer be reflective of current opinions or positions. Moreover, you should not assume that any discussion or information contained in this newsletter serves as the receipt of, or as a substitute for, personalized investment advice from SFEA. To the extent that a reader has any questions regarding the applicability of any specific issue discussed above to his/her individual situation, he/she is encouraged to consult with the professional advisor of his/her choosing. SFEA is neither a law firm nor a certified public accounting firm and no portion of the newsletter content should be construed as legal or accounting advice. A copy of SFEA’s current written disclosure Brochure discussing our advisory services and fees is available upon request. If you are a SFEA client, please remember to contact SFEA, in writing, if there are any changes in your personal/financial situation or investment objectives for the purpose of reviewing, evaluating, or revising our previous recommendations and/or services.