Time the market at your peril
May 15, 2023
That’s the title of a piece1 written by David Booth from Dimensional Funds. In the paper, Booth notes that equity index funds represent more than half of the ownership in the stock market. (For clarification, equity index funds are passively managed. An example of an equity index is a fund that owns all the companies within the S&P 500 Index. That’s in contrast to a mutual fund or ETF whereby the fund manager attempts to pick winners and losers in the stock market. That’s known as active management.)
Regardless of active or passive management, Booth notes that investors themselves actively trade index funds. Thus, one can only conclude that many investors think they have sufficient knowledge to time the market. That is, they know when to sell, and buy, and then do the same all over again “despite the overwhelming evidence and compelling story to the contrary…Picking stocks is more like gambling than investing.”
Russell Investments notes “…investors often buy when markets are euphoric and sell when markets are bearish. When we look at the 15-year period from 2008 – 2022, we’ve found that the average investor’s returns were 2.54% lower than the overall market’s returns.”
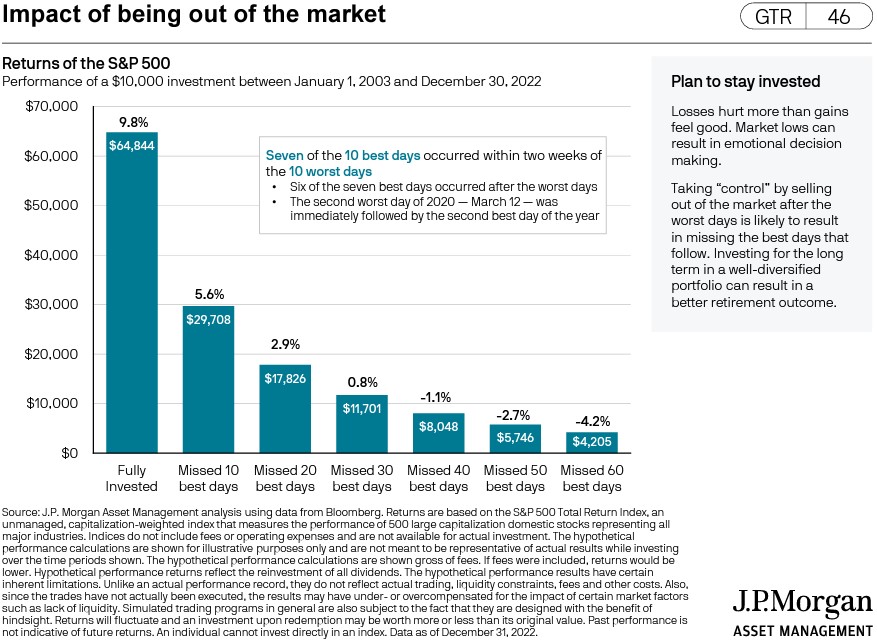
Using a table from the JP Morgan 2023 Guide to Retirement, the cost of trading the stock market can be quite expensive. (See table below).
A few conclusions from the data:
- Over the course of the 20-year period January 1, 2003 – December 31, 2022, a $10,000 investment in the S&P 500 Total Return Index would have returned 9.8% per year. (NOTE: The S&P 500 is an equity-only index, comprised of large and mega-cap companies. It is not a diversified portfolio, which would include fixed income, small-cap stocks, and equities from the international and emerging market sectors.)
- If you had missed the ten best days of that 20-year period because you were trying to time the market, the annual return would have dropped from 9.8% to 5.6%, an astounding difference considering we’re only talking about ten days out of 20 years!
- If you had missed the 20 best days, the returns would have fallen to 2.9% per year.
- As noted on the chart: “Seven of the 10 best days occurred within two weeks of the 10 worst days.”
- Six of the seven best days occurred after the worst days.
- The second worst day of 2020 – March 12 – was immediately followed by the second-best day of the year.”
Also noted on the chart: “Losses hurt more than gains feel good. Market lows can result in emotional decision making. Taking “control” by selling out of the market after the worst days is likely to result in missing the best days that follow.”
We know it’s often very difficult to stay the course during a crisis, but the numbers show that a successful retirement may depend on it. There’s an old saying that’s worth repeating: Time in the market is more important than timing the market.
1 Booth, David. “Time The Market at Your Peril.” Dimensional, 29 Nov. 2022.


