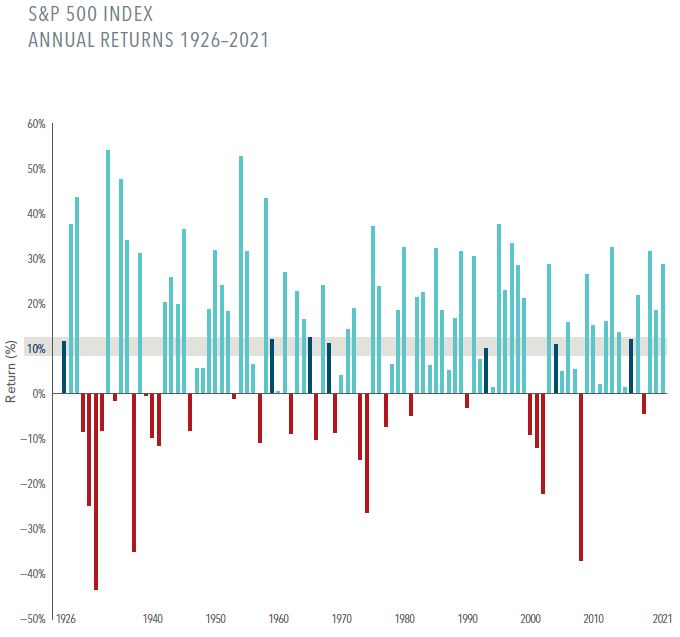
The chart below from Dimensional Funds1 depicts in graphic form how much the S&P 500 Index has gained (or lost) in every year since 1926. While the average annual return is approximately 10%, “it’s important to remember that returns in any given year may be sky-high, extremely poor, or somewhere in between.”
In fact, while the long-term average return may be approximately 10%, note that “Annual returns came within two percentage points of the market’s long-term average…in just seven of the past 96 years.” In other words, there’s a lot more volatility than the ‘smooth’ annual returns one might envision. (When viewing the chart, the horizontal gray bar shows the market average plus or minus two percentage points. Notice the mere seven times the Index actually falls within that range.)
In terms of volatility, “Yearly returns have ranged as high as up 54% and as low as down 43%.” (NOTE: This chart shows returns for calendar years only. Returns over other 12-consecutive month periods may be higher or lower.)
Finally, “Since 1926, annual returns have been positive 71 times and negative 25 times.”
1 “The Bumpy Road to the Market’s Long-Term Average.” Dimensional Fund Advisors, February 2022.
Please remember that past performance may not be indicative of future results. Different types of investments involve varying degrees of risk, and there can be no assurance that the future performance of any specific investment, investment strategy, or product (including the investments and/or investment strategies recommended or undertaken by S.F. Ehrlich Associates, Inc. (“SFEA”), or any non-investment related content, made reference to directly or indirectly in this newsletter will be profitable, equal any corresponding indicated historical performance level(s), be suitable for your portfolio or individual situation, or prove successful. Due to various factors, including changing market conditions and/or applicable laws, the content may no longer be reflective of current opinions or positions. Moreover, you should not assume that any discussion or information contained in this newsletter serves as the receipt of, or as a substitute for, personalized investment advice from SFEA. To the extent that a reader has any questions regarding the applicability of any specific issue discussed above to his/her individual situation, he/she is encouraged to consult with the professional advisor of his/her choosing. SFEA is neither a law firm nor a certified public accounting firm and no portion of the newsletter content should be construed as legal or accounting advice. A copy of SFEA’s current written disclosure Brochure discussing our advisory services and fees is available upon request. If you are a SFEA client, please remember to contact SFEA, in writing, if there are any changes in your personal/financial situation or investment objectives for the purpose of reviewing, evaluating, or revising our previous recommendations and/or services.