


Fun With Charts!
There are many old adages when it comes to investing. One that we like to cite is that a person’s success in the market depends on their time in the market, as opposed to timing the market. As we’ve pointed out on numerous occasions, trying to time the market – buy and sell when you believe the market will go up or down – is often a fool’s errand. Rather, the time that one stays invested in the market, through market highs and lows, will ultimately dictate success.
While we can control how long we’ll keep our funds invested in the market, we don’t get to control when markets will go up or down. In other words, there is an investment risk that revolves around the sequence of returns.
After saving for a lifetime, will the market do well the year you start retirement? And what happens if it doesn’t? Are some retirees more fortunate than others when it comes to the sequence of returns? The answer is yes.
While the sequence of returns is real and can significantly impact the quality of one’s retirement by impacting the quantity of one’s portfolio, there’s little you can do about it. While you can work longer to save more money (and delay withdrawals), you can’t predict the next great 10 years of market returns.
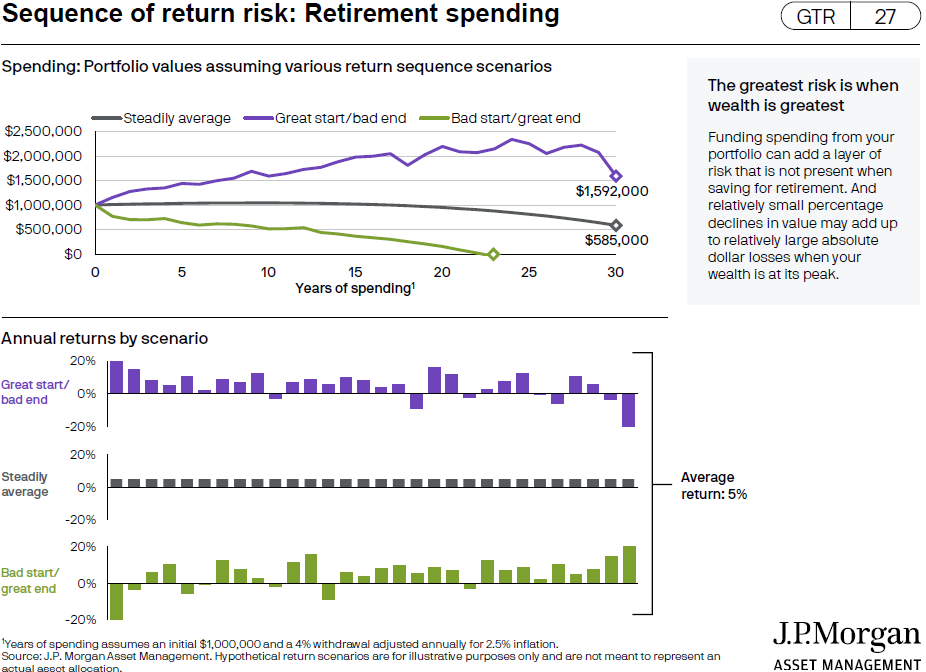
As the chart below1 shows, outsized investment returns (i.e., higher-than-average) when a person begins retirement can pay off handsomely.
The purple line, (the Great Start/Bad End scenario) starts with an initial investment of $1,000,000. After 30 years, to include 4% annual withdrawals adjusted for inflation, the balance is $1,592,000.
In contrast, note the green line (Bad Start/Great End scenario). Not only does the market drop during the early years, but the market drop, coupled with annual 4% withdrawal rates (adjusted for inflation), results in the portfolio running out of money less than 25 years after spending and withdrawals begin.
What doesn’t work when it comes to sequence of returns, is to run away and hide when markets turn south. Selling and moving to the sidelines is not a viable option. Sometimes, the cost of doing so can be significant.
First, there is the cost of missed opportunities, such as missing the days when markets have extraordinary returns. Second, there is often also a cost to selling existing investments, especially in a taxable brokerage account.
If you sell appreciated equities in a taxable account to convert your portfolio to ‘safe’ cash, you are likely to incur taxes on capital gains. When investments gain but are not sold, they’re not taxed because the gains are not realized. As soon as an investor sells appreciated investments in a taxable account, however, those gains are realized and taxed. (When investments are sold in a tax-deferred account, such as an IRA or 401k, those gains or losses are not reported on a tax return. Only withdrawals from tax-deferred accounts are taxable, not trading within those accounts.)
As shown below2, being out of the stock market and missing the market’s best-performing days can prove very costly. Over the period 2006-2025, if an investor stayed fully invested in the market - through the good times and bad - his/her portfolio would have achieved an annualized return of 11.0%. If that investor was out of the market during its 10 best days over that 20-year period, the annualized return would have dropped to 6.6%. That’s an extraordinary difference.
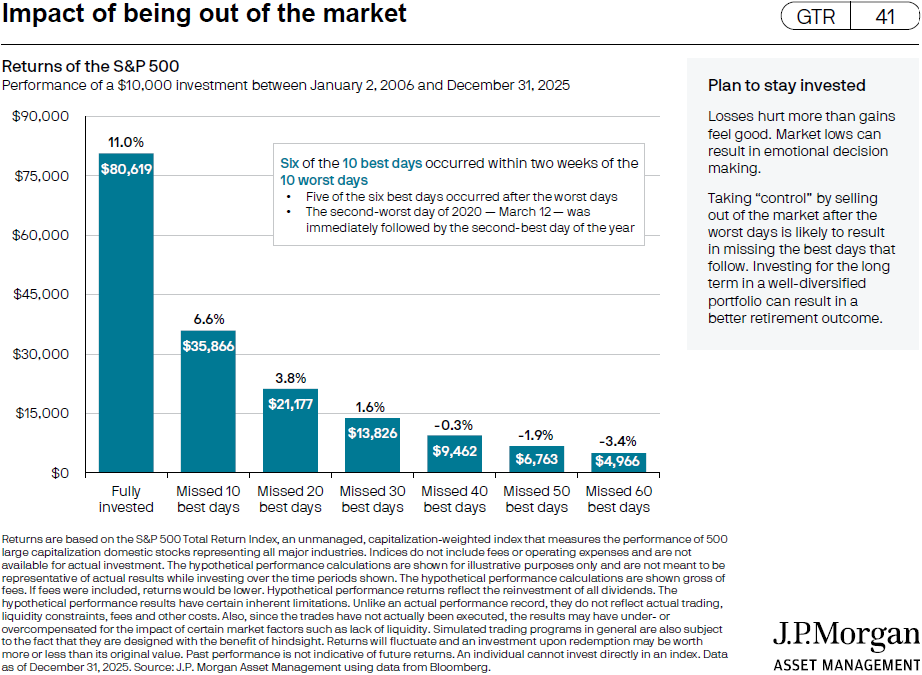
Also worth noting: “Six of the 10 best days occurred within two weeks of the 10 worst days,” demonstrating, once again, time in, is more important than timing.
1 “Sequence of return risk – Retirement spending,” Slide 27, Guide to Retirement, J.P. Morgan. December 31, 2025.
2 “Impact of being out of the market,” Slide 41, Guide to Retirement, J.P. Morgan. December 31, 2025.
S.F. Ehrlich Associates, Inc. (“SFE”) is a registered investment advisory firm in New Jersey that offers investment advisory, financial planning, and consulting services to its clients, who generally include individuals, high net worth individuals, and their affiliated trusts and estates. Additional disclosures, including a description of our services, fees, and other helpful information, can be found in our Form ADV Part 2, which is available upon request or on the SEC's website at www.adviserinfo.sec.gov/firm/summary/121356.
If you are an existing client of SFE, it is your responsibility to immediately notify us if there is a change in your financial situation or investment objectives for the purpose of reviewing, evaluating or revising any of our previous recommendations and/or services.
This newsletter is for informational purposes only and is not intended to be and does not constitute specific financial, investment, tax, or legal advice. It does not consider the particular financial circumstances of any specific investor and should not be construed as a solicitation or offer to buy or sell any investment or related financial products. We urge you to consult with a qualified advisor before making financial, investment, tax, or legal decisions.
Information contained herein has been obtained from sources believed to be reliable. While we have no reason to doubt its accuracy, we make no representations or guarantees as to its accuracy. The opinions and analyses expressed herein constitute judgments as of the date of this newsletter and are subject to change at any time without notice. Any decisions you make based upon any information contained in this newsletter or otherwise are your sole responsibility.
No graph, chart, formula, or other device can, in and of itself, be used to determine which securities to buy or sell, or when to buy or sell such securities, or can assist persons in making those decisions.
Any securities mentioned in this newsletter are for illustrative purposes only and should not be construed as investment advice or a recommendation to buy or sell. There is no guarantee that a particular client's account will hold any or all of the securities mentioned in this newsletter. Additionally, from time to time, SFE’s officers, directors, employees, agents, affiliates, or client accounts may hold positions or other interests in the securities mentioned in this newsletter.
Any historical index performance provided herein is for illustrative purposes and includes the reinvestment of dividends and income, but does not reflect advisory fees, brokerage commissions, and other expenses associated with managing an actual client account. An index is an unmanaged group of stocks considered to be representative of different segments of the stock market in general. Index performance does not represent actual account performance. One cannot invest directly in an index. A description of each index mentioned in this newsletter is available upon request.
Any hypothetical performance shown or discussed herein is for illustrative purposes only. Hypothetical performance results have inherent limitations, including: they are generally prepared with the benefit of hindsight; do not involve financial risk or reflect actual trading; and do not reflect the economic and market factors, such as concentration, lack of liquidity or market disruptions, trading costs, and other conditions, that might have impacted our decision-making when managing actual client accounts. Since trades have not actually been executed, hypothetical performance results may have under- or overcompensated for the impact, if any, of certain market factors.
It should not be assumed that future performance of any specific investment, investment strategy, or index (including any discussed in this presentation) will be successful or profitable or protect against loss.
Any forward-looking statements or projections herein are based on assumptions. By their nature, forward-looking statements involve a number of risks, uncertainties, and assumptions that could cause actual results or events to differ materially from those expressed or implied by the forward-looking statements. You should not place undue reliance on forward-looking statements, which reflect our judgment only as of the date this newsletter was published.