


Fun With Charts!
If you’re wondering why (and how) the stock market keeps going up during a war with Iran that has caused oil prices to spike, you’re not alone. It seems the Wall Street Journal1 can’t write enough articles about why the market is up or down, and what it may or may not do next. Spend time reading all of them, and the result will be two Advil for your headache.
All we can report is that stock prices are driven by profits. They always have been, and it’s likely they always will be. If a company produces widgets and increases its widget profits each year, history tells us that the company’s stock price will increase over time.
If the widget company introduces a new line of widgets that will generate much more revenue in the future, the stock price will probably increase substantially. And if a larger company decides to buy the widget maker, then it’s also likely that there will be a further increase in the stock price. (Of course, the reverse would happen if the widget maker were to lose money.) In the simplest of terms, that’s how the stock market works.
Even in the midst of a war, if investors believe companies will grow their profits, they will invest in future growth. And that may be what’s happening now.
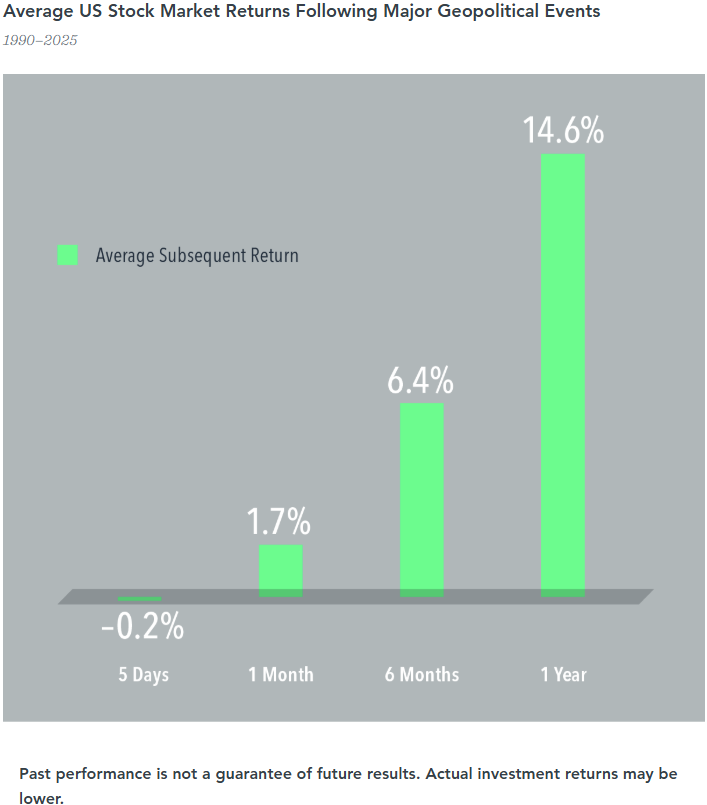
But even if that interpretation is wrong, the chart below shows that markets perform well when major geopolitical events, such as a war, end. As we’ve said so many times, investing is a marathon, and disruptions along the way are to be expected. They should not, however, get in the way of the long-term goal: to grow assets over time.
In terms of how the stock market performed when the war started, the S&P 500 “peaked on Jan 27, and then fell 9.1% through March 30th. By April 15, a mere 16 days later, the market had returned to a new high…Kevin Khang, senior global economist at Vanguard, examined every market decline of at least 9 percent since 1950. There were 32 of them…and the recent Iran war rebound has been the fastest of all. For these rebounds, the median length – the point in the middle – was 107 days. The average rebound took much longer, 309 days. The stock market’s recovery this time occurred in the comparative blink of an eye.” 2
Investors in the bond market, however, focus on interest rates and companies' ability to make timely payments on their debt. This year, the bond market sees things a little differently than the stock market.
As you may recall, when interest rates rise, bond prices generally fall. Let’s say you paid $1,000 for a 5-year bond with a 4% coupon. If interest rates go up and you can now get 4½% on a similar bond, nobody will pay you $1,000 for your bond. To get your $1000 back, you would have to wait until the bond matures. If you were to sell it early, you would lose money.
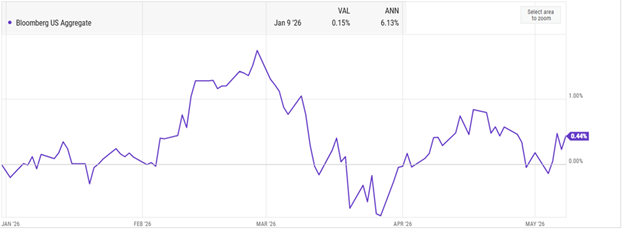
The chart below shows how the Bloomberg US Aggregate Bond Total Return Index - a common index to assess the bond market’s performance - has done year-to-date through May 8th. Yes, the underlying bonds are still paying interest, but the market is cautiously waiting to decide whether interest rates will rise or fall in response to the war, oil prices, and inflation.
1 Crill, Wes. “Market returns during past geopolitical conflicts,” Dimensional.com, May 5, 2026.
2 Sommer, Jeff. “Stocks Are Exuberant. Bonds Are Subdued. Why the Divergence?” The New York Times, 8 May 2026.
S.F. Ehrlich Associates, Inc. (“SFE”) is a registered investment advisory firm in New Jersey that offers investment advisory, financial planning, and consulting services to its clients, who generally include individuals, high net worth individuals, and their affiliated trusts and estates. Additional disclosures, including a description of our services, fees, and other helpful information, can be found in our Form ADV Part 2, which is available upon request or on the SEC's website at www.adviserinfo.sec.gov/firm/summary/121356.
If you are an existing client of SFE, it is your responsibility to immediately notify us if there is a change in your financial situation or investment objectives for the purpose of reviewing, evaluating or revising any of our previous recommendations and/or services.
This newsletter is for informational purposes only and is not intended to be and does not constitute specific financial, investment, tax, or legal advice. It does not consider the particular financial circumstances of any specific investor and should not be construed as a solicitation or offer to buy or sell any investment or related financial products. We urge you to consult with a qualified advisor before making financial, investment, tax, or legal decisions.
Information contained herein has been obtained from sources believed to be reliable. While we have no reason to doubt its accuracy, we make no representations or guarantees as to its accuracy. The opinions and analyses expressed herein constitute judgments as of the date of this newsletter and are subject to change at any time without notice. Any decisions you make based upon any information contained in this newsletter or otherwise are your sole responsibility.
No graph, chart, formula, or other device can, in and of itself, be used to determine which securities to buy or sell, or when to buy or sell such securities, or can assist persons in making those decisions.
Any securities mentioned in this newsletter are for illustrative purposes only and should not be construed as investment advice or a recommendation to buy or sell. There is no guarantee that a particular client's account will hold any or all of the securities mentioned in this newsletter. Additionally, from time to time, SFE’s officers, directors, employees, agents, affiliates, or client accounts may hold positions or other interests in the securities mentioned in this newsletter.
Any historical index performance provided herein is for illustrative purposes and includes the reinvestment of dividends and income, but does not reflect advisory fees, brokerage commissions, and other expenses associated with managing an actual client account. An index is an unmanaged group of stocks considered to be representative of different segments of the stock market in general. Index performance does not represent actual account performance. One cannot invest directly in an index. A description of each index mentioned in this newsletter is available upon request.
Any hypothetical performance shown or discussed herein is for illustrative purposes only. Hypothetical performance results have inherent limitations, including: they are generally prepared with the benefit of hindsight; do not involve financial risk or reflect actual trading; and do not reflect the economic and market factors, such as concentration, lack of liquidity or market disruptions, trading costs, and other conditions, that might have impacted our decision-making when managing actual client accounts. Since trades have not actually been executed, hypothetical performance results may have under- or overcompensated for the impact, if any, of certain market factors.
It should not be assumed that future performance of any specific investment, investment strategy, or index (including any discussed in this presentation) will be successful or profitable or protect against loss.
Any forward-looking statements or projections herein are based on assumptions. By their nature, forward-looking statements involve a number of risks, uncertainties, and assumptions that could cause actual results or events to differ materially from those expressed or implied by the forward-looking statements. You should not place undue reliance on forward-looking statements, which reflect our judgment only as of the date this newsletter was published.