


Fun With Charts!
When you hear the phrase ‘the market is rich,’ it refers to the stock market having a high P/E ratio. A P/E ratio is a stock’s price divided by its earnings over the past 12 months. Thus, if the share price of a stock is $100, and the annual earnings for that stock are $10, the P/E ratio is 100/10 = 10.
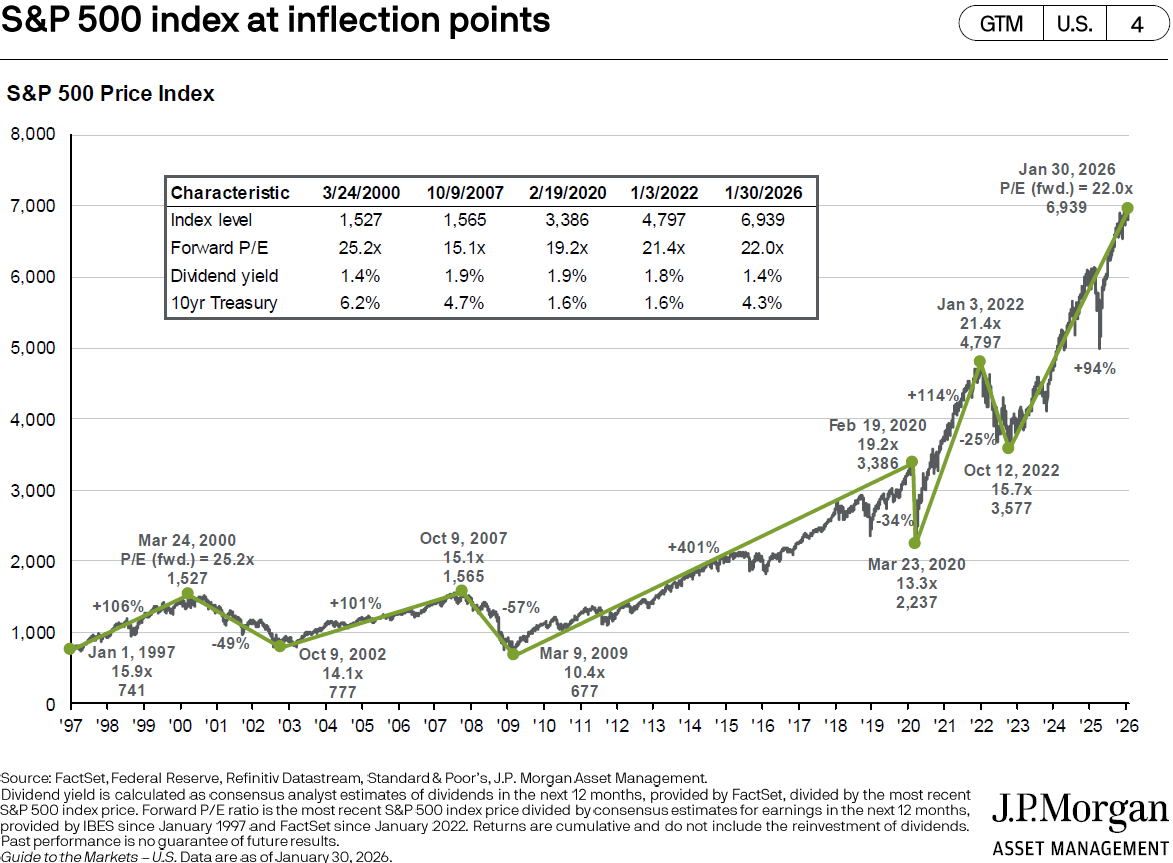
Stock valuations matter. The chart below1 shows the correlation between P/E ratios and future returns. Notice, for example, what happens to stock prices when P/E ratios peak. Over succeeding years, stock prices often go down. They’ll eventually bottom, rise, and peak again. (As the chart shows, these cycles recur over and over, for various lengths of time.)
As shown on the graph, the term P/E fwd (forward) is the price of the S&P 500 Index divided by its projected earnings over the next 12 months.
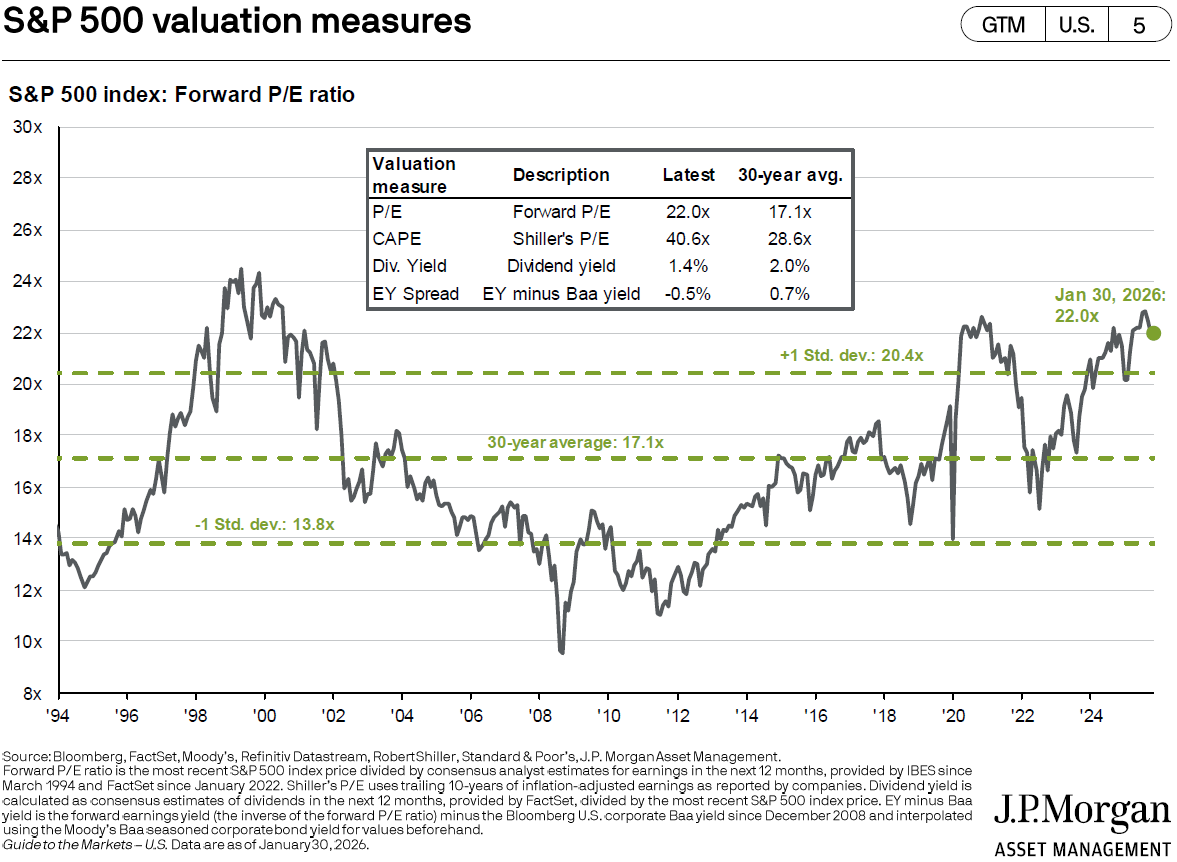
The chart below2 shows the 30-year average forward P/E ratio is 17.1, while the chart above shows the forward P/E ratio as of 1/31/2026 was 22.0. Seeing that, your first reaction might be to sell everything and head for cash.
Yes, we’re heading towards a peak, or may even be near a peak, but we don’t know where the top is. And selling too early may mean ‘leaving money on the table.’ Rather than randomly picking peaks and valleys, we address record-setting stock prices by rebalancing and building up the fixed-income sides of portfolios. But that’s not new news; you already know that.
One caveat worth noting about current stock valuations. There is a significant concentration of mega-cap technology stocks within the S&P 500, and tech stocks often have higher P/E ratios because they tend to grow faster.
We’ve witnessed outsize valuations by formerly dominant companies in the past (e.g., GE, IBM, General Motors), and we’ve also seen those once-great companies lose their leadership positions. While some may argue “This time it’s different,” we’ve also heard those words uttered far too many times.
The takeaway from high P/E ratios is to temper your expectations for market returns over the next few years as the cycle plays out. Yes, the average return of the S&P 500 may be approximately 10% over the past 100 or so years, but history also shows it’s never a smooth ride.
1 “S&P 500 index at inflection points,” Slide 4, Guide to the Markets, J.P. Morgan. Jan 31, 2026.
2 “S&P 500 valuation measures,” Slide 5, Guide to the Markets, J.P. Morgan. Jan 31, 2026.
S.F. Ehrlich Associates, Inc. (“SFE”) is a registered investment advisory firm in New Jersey that offers investment advisory, financial planning, and consulting services to its clients, who generally include individuals, high net worth individuals, and their affiliated trusts and estates. Additional disclosures, including a description of our services, fees, and other helpful information, can be found in our Form ADV Part 2, which is available upon request or on the SEC's website at www.adviserinfo.sec.gov/firm/summary/121356.
If you are an existing client of SFE, it is your responsibility to immediately notify us if there is a change in your financial situation or investment objectives for the purpose of reviewing, evaluating or revising any of our previous recommendations and/or services.
This newsletter is for informational purposes only and is not intended to be and does not constitute specific financial, investment, tax, or legal advice. It does not consider the particular financial circumstances of any specific investor and should not be construed as a solicitation or offer to buy or sell any investment or related financial products. We urge you to consult with a qualified advisor before making financial, investment, tax, or legal decisions.
Information contained herein has been obtained from sources believed to be reliable. While we have no reason to doubt its accuracy, we make no representations or guarantees as to its accuracy. The opinions and analyses expressed herein constitute judgments as of the date of this newsletter and are subject to change at any time without notice. Any decisions you make based upon any information contained in this newsletter or otherwise are your sole responsibility.
No graph, chart, formula, or other device can, in and of itself, be used to determine which securities to buy or sell, or when to buy or sell such securities, or can assist persons in making those decisions.
Any securities mentioned in this newsletter are for illustrative purposes only and should not be construed as investment advice or a recommendation to buy or sell. There is no guarantee that a particular client's account will hold any or all of the securities mentioned in this newsletter. Additionally, from time to time, SFE’s officers, directors, employees, agents, affiliates, or client accounts may hold positions or other interests in the securities mentioned in this newsletter.
Any historical index performance provided herein is for illustrative purposes and includes the reinvestment of dividends and income, but does not reflect advisory fees, brokerage commissions, and other expenses associated with managing an actual client account. An index is an unmanaged group of stocks considered to be representative of different segments of the stock market in general. Index performance does not represent actual account performance. One cannot invest directly in an index. A description of each index mentioned in this newsletter is available upon request.
Any hypothetical performance shown or discussed herein is for illustrative purposes only. Hypothetical performance results have inherent limitations, including: they are generally prepared with the benefit of hindsight; do not involve financial risk or reflect actual trading; and do not reflect the economic and market factors, such as concentration, lack of liquidity or market disruptions, trading costs, and other conditions, that might have impacted our decision-making when managing actual client accounts. Since trades have not actually been executed, hypothetical performance results may have under- or overcompensated for the impact, if any, of certain market factors.
It should not be assumed that future performance of any specific investment, investment strategy, or index (including any discussed in this presentation) will be successful or profitable or protect against loss.
Any forward-looking statements or projections herein are based on assumptions. By their nature, forward-looking statements involve a number of risks, uncertainties, and assumptions that could cause actual results or events to differ materially from those expressed or implied by the forward-looking statements. You should not place undue reliance on forward-looking statements, which reflect our judgment only as of the date this newsletter was published.